To cut the story short, I will like to share how I have applied my own future modeling using Singapore Companies as case studies. Readers who are interested, please read the book, as I am just trying to scratch the surface with my explanation.
First Step: Look for Market leader.
The reason is simple. I want a company that can captured the industry upturn. A company that will gain when industry turn around and not continue to be a laggard.
The example, I am using is PAN United. Looking at Revenue.
Pan United Rev from Cement and Construction materials
2018: 545,710,000
2017: 527,674,000
2016: 577,639,000
2015: 668,421,000
You can see from here there is some sort of correlation and according to https://brandongaille.com/18-singapore-cement-industry-statistics-and-trends/
PAn united is the biggest Cement supplier. Engro, another Cement Supplier listed Singapore managed
2018: 153 mio
2017: 141 mio
2016: 144 mio
So I think there is no doubt Pan United is a Key Market Player that will stand to gain when industry upturn happen.
Second Step: Check for correlation
Profits from the segment of construction material
2018: 8,496,000 with rev 545,710,000
2017: 8,958,000 with rev 527,674,000
2016: 10,657,000 with rev 577,639,000
2015: 12,859,000 with rev 668,421,000
2014: 24,219,000 with rev 612,097,000
2013: 39,406,000 with rev 599,049,000
You can see margin destroyed due to lower demand as well as competition. But Pan United has hold market share reasonable well.
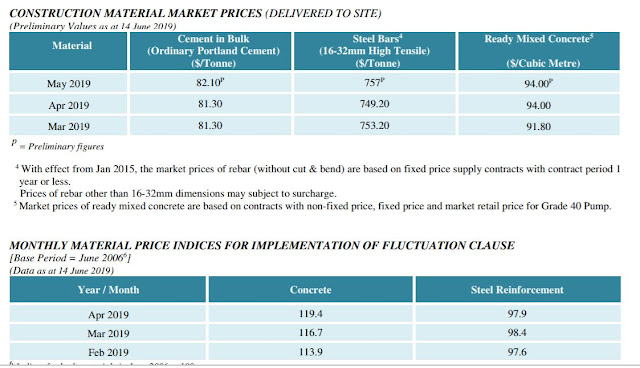
One more chart.
You can see the "good times" correlate to good price of cement RMC.
I am aware of different grade of RMC, the one included in BCA statistic is Grade 40, and there are different type of Concrete, some quick solidifying, some green and carbon neutral, but I still think is a reasonable calculated guess.
So is 2016 - 2018 horrible years in construction demand? From BCA data, the demand for construction in those three years are:
(Data from BCA)
2018 - 27 bio
2017 - 24.5 bio
2016 - 26.1 bio
2015 - 27.2 bio
2014 - 37 bio
Again, it seem 2014 is the golden year for a good reason.
BCA projection of demand is always announced in January. In January the projection is
Third: Guess Industry upturn
It seem it is going to be a slow year yet again, but the 9 bio expansion by MBS and Genting are announced in April, and I am quite sure assuming 3 Bio A year over the next 2 years when construction start, this demand is not captured in the projection, at least not accounted for in the lower end of projection
Worst case scenario, up to April, it is on track to hit the lowest 27 Bio Demand, so it should not get any worse. Reading on Pan United Quarter reports and BCA announcement of big tenders, various En-Bloc redevelopment again seem un-captured in 2018.
RMC price is better in Q2 than in Q1, and Pan United Q1 results is already better in 2019, than 2018. I assume that the worst is over for Pan United.
In the book, the author model precise earnings.
I will pass giving a giving an exact figure, I will instead guess a range of possible earnings. Assuming if price of RMC return to the good old days of 110 and above, will margin be closer to the bountiful of years of above 5% ( >6% in 2014)?
2018 margin is at 1.5%, it does not need a party for margin to double. Assume Status Rev 550 mio in 2019 and 600 mio in 2020 (Where the demand for the IR should start flowing), and Margin of 1.8% in 2019 and 2% in 2020, we should see profits of 9.9 mio and 12 mio.
Even if margin double, the best case and most optimistic scenario, it is still only half of what it is like in the good old years. So for a conservative projection, we see EPS of about 1.4 cents, 1.66 cents in 2020.
Assuming pay out ration of 80%, dividend will 1.12 cents and 1.32 cents.
So at current price, PE for 2019 can be 24 times or at good as 12 times (If margin improve to 3%)
Yield can be 3% or 6%
So at current price, it makes no sense for me to add, no matter how much I like it. I bought my first tranche of Pan United at 28.5 cents, so valuation use, it makes slighly more sense at future PE of 20 times or 10 times, and dividend of near 4% to 8%
As I mention earlier, I did a range of valuation than giving a fix figure, but if second quarter earnings makes 1H earning out of my expected range of earning, I know it is time to say good bye.
.................................................................................................................................................
This is the first time, I spent so much time writing an article on investment, I will leave QAF modeling to next time. (Not vested in QAF)


